College Baseball’sTransfer Transformation
The reckoning came in 2022. That was the year the landmark NCAA transfer exception went into effect. Since then, transfer rules have loosened even more. All of this has fundamentally shifted how Division I programs build teams. Essentially, college baseball has moved to a perennial state of free agency, as players have more freedom to switch teams during their eligibility years. The situation remains in flux, with potential legislation, more lawsuits and additional rule changes.
Anyone following the sport has already seen the effects anecdotally. Coaches have also been candid about how the portal and, more recently, roster-size cutdowns to 34 from 40 along with fifth-year eligibility have transformed how they recruit. After five years, we now have more substantive data and are starting to get a clearer quantitative picture of how transfers are reshaping college baseball.
We’ve been analyzing the transfer phenomenon using our Match Finder data model and discovered some interesting findings. Our method went through Division I rosters, player by player, to take stock of the effects. We tracked transfer changes across five seasons, 2022 through 2026. (We use 2021 rosters only as a starting baseline.) To enable deeper analysis, we then broke transfer moves down further into two primary categories:
- New transfers. Players joining for their first season at a program who came from another college, either a four-year school or a junior college (JUCO), measured as a share of roster size. Think of this as the yearly refresh rate to fill spots in lieu of previous roster holders or high school recruits.
- Total transfers (new and returning). All players on a 2026 roster who began their college careers at another four-year school or JUCO, whether they arrived in 2026 or earlier. Think of this as the stock: how much of a roster was built from other programs over time. New transfers are one part of total transfers; the rest are returning transfers in their second, third, fourth or, soon, fifth season at the program.
Free agency taking over
There has been a predictable climb in transfer reliance to build rosters since the NCAA began opening up the transfer spigot in 2022. Each season, a larger share of the average Division I roster was made up of new transfers from other colleges. The cumulative effect is a step-change from how programs previously developed rosters internally. Homegrown rosters are now in the minority.
Roster share of total transfers (new and returning) in 2026. The 52% counts every player who began his college career at another school, including transfers in their second, third or fourth season with a program. (Starting with the upcoming season, college players can have up to five years of eligibility.)
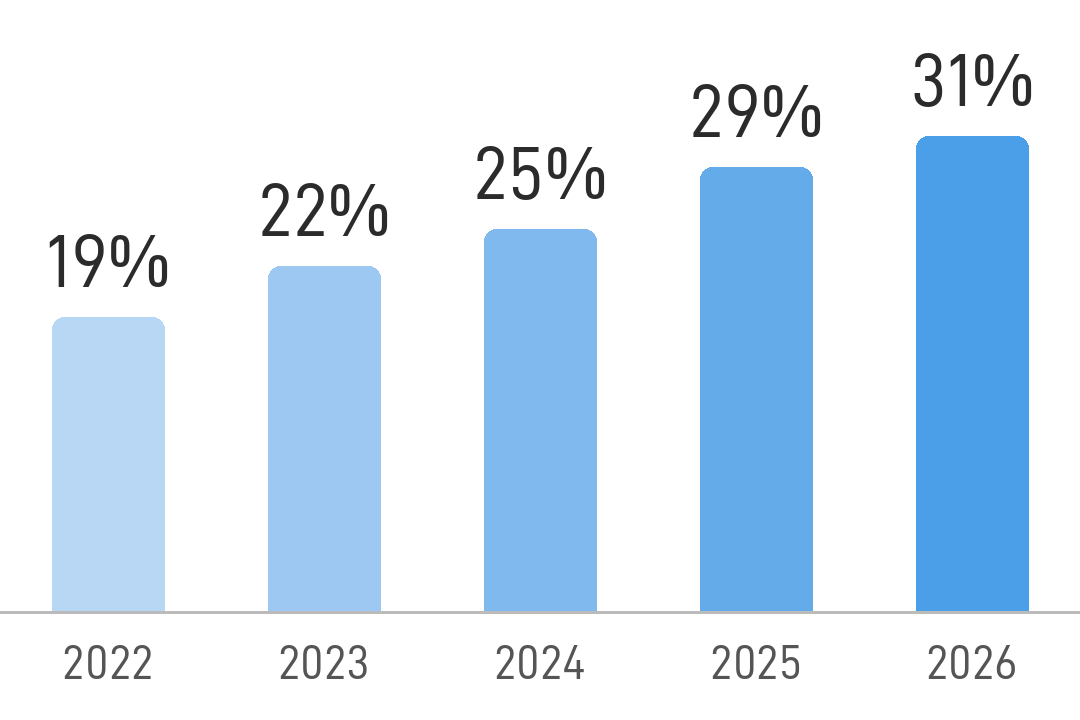
New transfers, the yearly measure. Average share of new transfers on a Division I roster in 2026. The share has climbed every year since 2022, from 19% that season to 22%, 25%, 29% and 31% in 2026. That’s more than MLB free agency, when measured as a typical share of the total roster.1
New transfers, five-season average. The average share of new transfers on a Division I college roster each year over the past five seasons. If you weight 2022 to 2026 for recency, this average is closer to 27% yearly.
Newcomers on 2026 rosters were new transfers. The flip side: high school recruits are getting squeezed out of Division I recruiting. Transfers are gobbling up roster slots for players in their first season at a program.
2026 was the tipping point. Last season was the first in our data in which total transfers outnumbered players who have stayed at the school from the beginning. In all, more than half of programs now field rosters where total transfers make up at least half the roster.2 The trend is pretty bleak for those hoping to play Division I baseball right after high school. Such players are now competing for a spot not only with their own recruiting class but, increasingly, with players who are older and already have college experience.
Note: 2026 was also the first season under the 34-player roster limit. Listed rosters shrank slightly, new transfers per team held about steady (11.4 to 11.8), and freshmen per team fell (9.7 to 8.3). This also preceded fifth-year college eligibility taking effect.
Power vs. Mid-Major: similar flow, different foundations
It is actually Mid-Major programs, not Power conference programs, that lean further on transfers, though the difference is small. Weighted toward recent seasons, new transfers average about 25.5% of the roster at D1 Power programs3 and about 27.2% at Mid-Majors. The real gaps show up in two other places:
- Total transfers on 2026 rosters. New and returning transfers made up 45% of 2026 rosters at Power programs, compared with 56% at Mid-Majors.
- Where transfers come from. At Power programs, 29% of 2022–2026 transfers came from JUCOs. At Mid-Majors, it was 50%. These are shares of transfers, not of the roster.
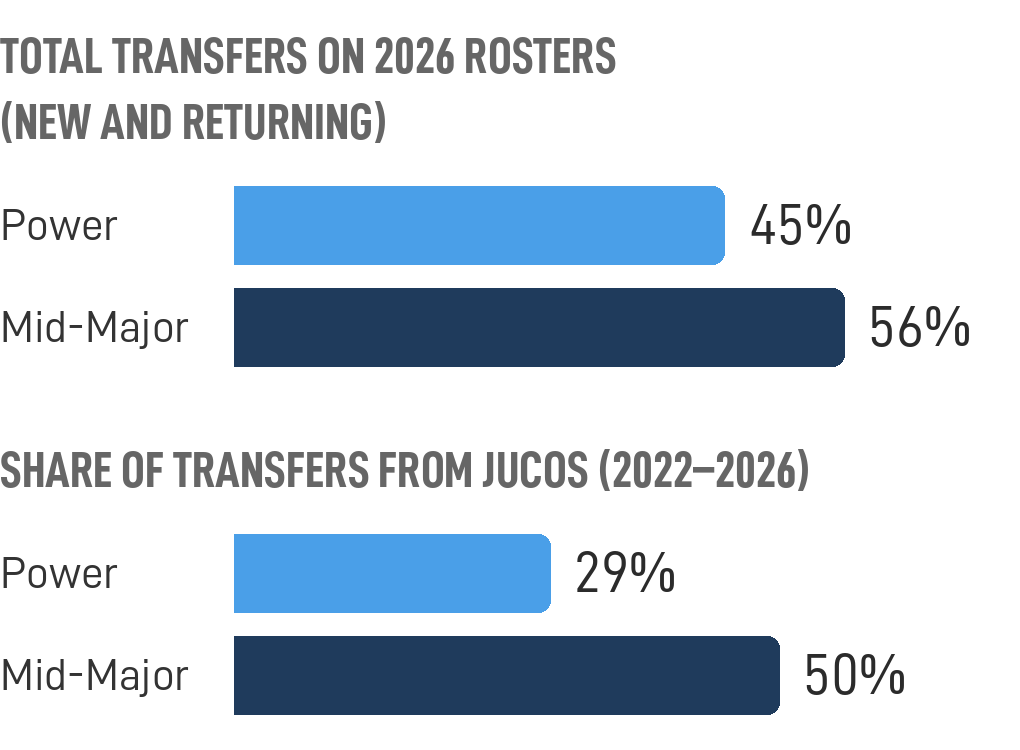
Mid-Majors don’t bring in dramatically more new transfers each year, but total transfers make up more of their rosters, and that journey often runs through JUCO.
The JUCO pipeline may be narrowing
JUCOs have long been one of the main routes to Division I, and they still are. But the mix may be shifting.
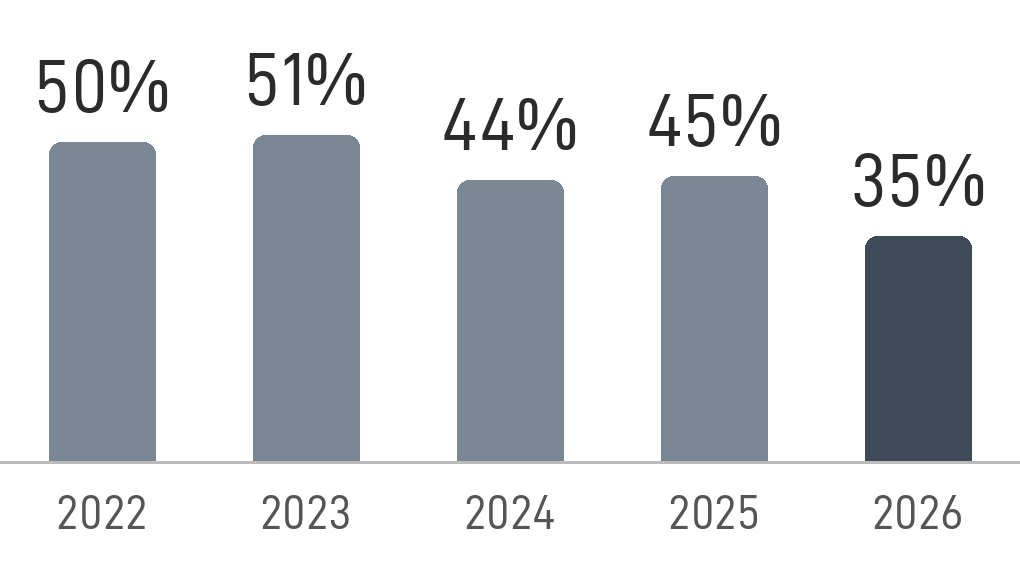
- About 44% of D1 transfers came from JUCOs4 from 2022–2026. That’s a share of all transfers, not of the roster, and it has been falling.
- The JUCO share of transfers has fallen about 15 points in four years. In 2022 and 2023, roughly half of all transfers came from JUCOs. By 2026, that share had fallen to 35% as transfers from four-year programs rose. Recently, more of the players moving over to D1 programs come from other four-year schools.
Transfers and winning
More transfers, more wins? Not necessarily
In our data, teams that relied more on transfers didn’t win more from 2022 to 2026.
win rate for D1 programs in the top quarter for new-transfer share.
win rate for D1 programs in the bottom quarter for new-transfer share.
The gap appears to track with JUCO transfers. Programs that brought in the most JUCO transfers relative to roster size won .486 of their games, compared with .559 for those that brought in the fewest, and that gap holds within conferences. Transfers from four-year schools show no statistically significant link in our model to winning when compared to other teams within the same conference. Programs also tended to add more transfers in the season after a losing year.
Admittedly, our main test falls just short of the usual bar for statistical significance. So the finding isn’t that transfers hurt. The point that our numbers do make is that more transfers does not inherently mean better winning records.
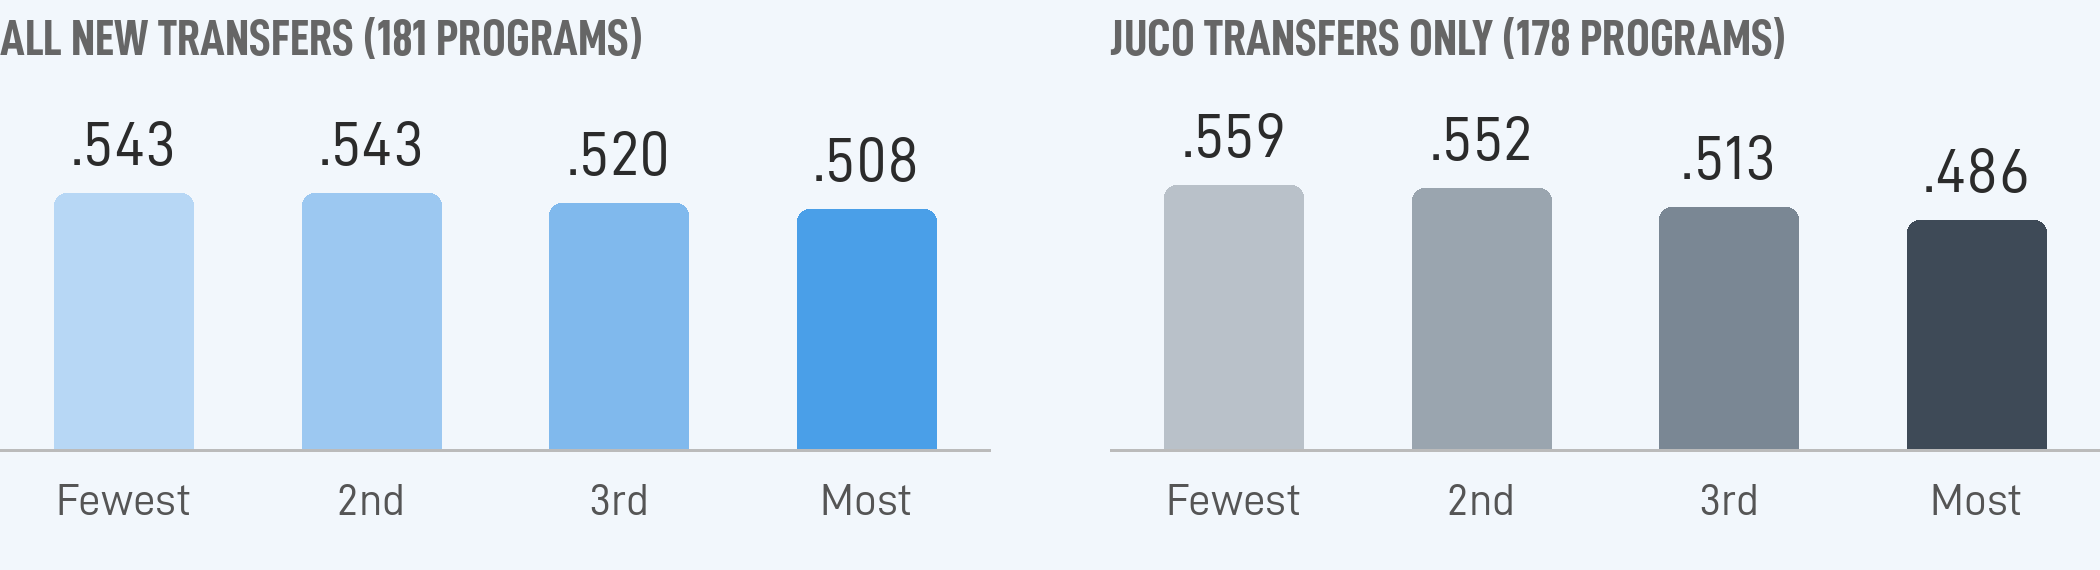
How we measured: regular-season games against D-I opponents only, 2022–2026, for 181 D1 programs with at least four seasons of solid roster data (178 for the JUCO split). New-transfer share is weighted toward recent seasons.
The most transfer-heavy and most homegrown programs
Below are the programs at each end of the spectrum, ranked by new-transfer share weighted toward recent seasons. We include only programs with high-confidence roster data.5
Most transfer-heavy
New transfers as a share of roster, weighted toward recent seasons, 2022–2026
| # | D1 Power | New-transfer share |
|---|---|---|
| 1 | Kansas | 48.8% |
| 2 | South Carolina | 41.0% |
| T3 | Houston | 39.0% |
| T3 | Purdue | 39.0% |
| 5 | Georgia | 38.3% |




| # | D1 Mid-Major | New-transfer share |
|---|---|---|
| 1 | Southern Illinois | 63.3% |
| 2 | New Orleans | 51.0% |
| 3 | UNLV | 49.0% |
| 4 | Stephen F. Austin | 48.7% |
| 5 | Charlotte | 48.1% |





UCF (42.0%) is left out because we have only three seasons of its roster data.6
Most homegrown
Lowest new-transfer share, weighted toward recent seasons, 2022–2026
| # | D1 Power | New-transfer share |
|---|---|---|
| 1 | UCLA | 7.9% |
| 2 | Vanderbilt | 12.3% |
| 3 | Louisville | 14.0% |
| 4 | Clemson | 15.0% |
| 5 | Boston College | 17.3% |




| # | D1 Mid-Major | New-transfer share |
|---|---|---|
| 1 | Liberty | 3.5% |
| 2 | UC Davis | 8.8% |
| T3 | George Washington | 10.4% |
| T3 | Portland | 10.4% |
| 5 | Kent State | 10.6% |





Stanford (5.4%) is left out because we have only three seasons of its roster data.6
A note on Ivies and service academies: By design, you won’t find Army, Navy, Air Force or the Ivy League programs in the Homegrown rankings. These schools rarely take transfers in the usual sense: they have more stringent eligibility and academic requirements for transfers. In the case of the academies, there are also service commitments. Stanford is also an outlier similar to this peer group.
Takeaways
- Wide fluctuation. At Southern Illinois, new transfers make up 63.3% of the roster on a recency-weighted basis, nearly two of every three players. At UCLA, it’s 7.9%. Both Division I, but two very different ways to build a team.
- Homegrown is still alive among some top programs. Some of the most established Power programs in the sport, including UCLA, Vanderbilt, Louisville and Clemson, remain among the most homegrown. A development-first approach hasn’t completely disappeared in the portal era.
- Transfer-heavy crosses tiers. Kansas, at 48.8%, would sit among the Mid-Major top five. Leaning on transfers isn’t only a Mid-Major strategy, and it isn’t only a Power one either.
The ‘Free Agency’ conferences
Grouping programs by conference shows the same pattern on a larger scale. Here are the five most transfer-heavy conferences among those with at least seven programs in our data.7
Most transfer-heavy conferences
Average new-transfer share of member programs, weighted toward recent seasons, 2022–2026
| # | Conference | Programs | New-transfer share |
|---|---|---|---|
| 1 | Southland | 10 | 39.0% |
| 2 | UAC | 8 | 36.4% |
| 3 | American | 10 | 34.7% |
| 4 | Missouri Valley | 9 | 31.3% |
| 5 | Big 12 | 14 | 30.3% |
At the other end, the most homegrown conferences are tightly bunched, all within about two percentage points of one another, so we’d treat them as a group rather than a strict ranking: the Atlantic 10 (about 20.1%), CAA (20.5%), ACC (21.5%), WCC (22.0%) and Big East (22.3%).8
Takeaways
- The Southland leads the way. Nearly four in ten players on a typical Southland roster are new transfers, and two of the Mid-Major top five, New Orleans and Stephen F. Austin, play there.
- The Big 12 is the Power outlier. It’s the only Power conference among the five most transfer-heavy, with Kansas and Houston among its leaders.
- The ACC leans more toward homegrown. It’s the only Power conference in the homegrown group, alongside four Mid-Major leagues.
A note on other divisions: a limited pilot of 30 Division II programs saw new transfers rise from about 16% to about 25% of the roster over 2022–2026; Division III data isn’t reliable enough to report yet.
Full Access
See new transfers for every D1 program, and for yours
Using Match Finder, you can see new transfers each season, as a share of the roster, for all 219 Division I programs we track, including ranking programs based on your priorities. With Full Access, you can also sort your Match List by it or set a range.
How we counted
Our figures come from official team roster pages (largely on the Sidearm platform), including each player’s listed previous school, for 219 Division I programs. We measure five seasons, 2022–2026, and use 2021 rosters only as a baseline. Staff and honorary roster entries are excluded. Shares are measured against everyone listed on a team’s online roster (about 38 players per team in 2026), not the 34-player limit. A player counts as a new transfer in his first season with a program if he came from another four-year college or a JUCO. For total transfers (new and returning), a player with no listed previous school is treated as homegrown, and we limit 2026 to the 186 programs whose previous-school data is complete enough to trust. Program and tier averages give each program equal weight. JUCO figures are the share of all transfers in the period who came from a JUCO, pooled across programs; they are shares of transfers, not of the roster. “Weighted toward recent seasons” uses the same season weights as Match Finder’s Homegrown Roster metric.
Notes
- MLB comparison: FanGraphs RosterResource, 40-man roster breakdown (fangraphs.com/roster-resource/breakdowns/40-man-roster), as of Oct. 9, 2026. Players acquired as free agents average about 16% of an MLB team’s 40-man roster (team average), and 21 of 30 teams are under 20%. That figure counts every free-agent signing still on the roster; our college figure for 2026 counts new transfers alone (31%). ↩
- That’s 102 of the 186 programs with clean previous-school data. “At least half” means total transfers (new and returning) made up 50% or more of the 2026 roster. ↩
- D1 Power includes the Power 4 conferences (ACC, Big 12, Big Ten, SEC) plus Oregon State, 64 programs in all. The other 155 roster-tracked D1 programs are Mid-Majors. ↩
- We classify each transfer by the last school he attended before arriving. A player who went from a JUCO to a four-year school and then to his current program counts as a four-year transfer. These classifications come from roster listings and were spot-checked by hand, not verified player by player. ↩
- High confidence means at least four measured seasons, with no more than one of them estimated rather than read directly from roster listings. Ivy League programs, Army and Navy are not ranked because they aren’t part of this roster data set yet. ↩
- UCF (42.0%) and Stanford (5.4%) would make these lists, but each has only three measured seasons in our data, so we left them off the rankings. ↩
- Conferences use 2026–27 membership, while the figures reflect each member program’s 2022–2026 history. Conference averages give each program equal weight. ↩
- The Southern Conference averages 18.1% across eight programs, but only four of them have high-confidence data, so we left it out of this group. ↩
Source for all other figures: College Baseball Match Finder by CoJoMojo, D1 roster data, 2021–2026 seasons; regular-season win-loss records from Warren Nolan (D-I opponents; conference tournaments and NCAA postseason excluded).